Trading the Convergence of a Distorted Oil Curve
When the front month (Sept 2026 WTI contract) gets too rich relative to the back month (Dec 2026), the opportunity is not just “oil up” or “oil down.” The real opportunity is in the curve itself: selling the expensive month, buying the cheaper deferred month, and positioning for backwardation to normalize.
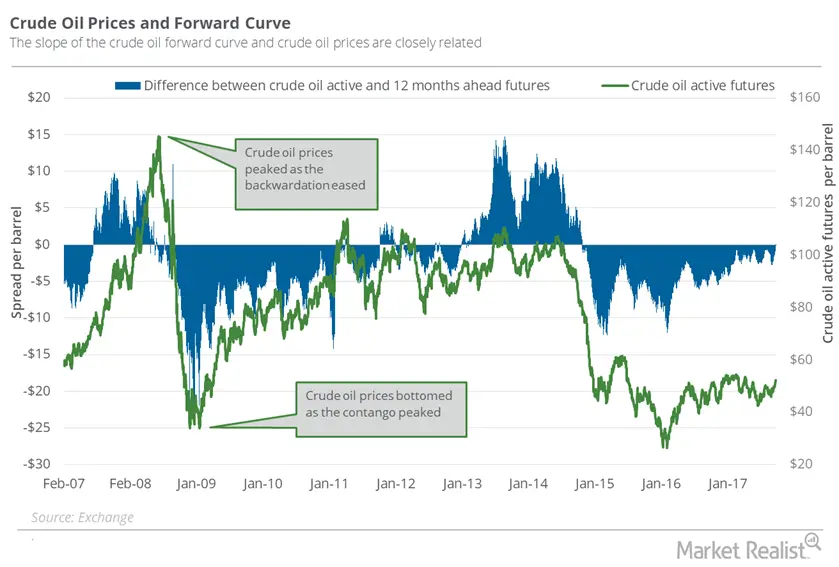
Oil has repeatedly shown the same pattern: scarcity and urgency blow out the front of the curve, then normalization compresses the spread. The exact trigger changes — war, embargo, sanctions, OPEC discipline, logistics stress, inventory squeeze — but the opportunity repeats because markets consistently overpay for immediate barrels during panic.
Backwardation creates opportunity because it is the market’s way of overpaying for immediacy. When traders, refiners, and hedgers are desperate for prompt barrels, the nearby contract can become inflated relative to the deferred strip. That distortion is exactly what makes a convergence trade attractive.
The edge is not that oil must collapse. The edge is that the spread can tighten even if crude stays elevated. If the urgency premium in September fades faster than the value embedded in December, the curve flattens and the calendar spread can pay.
1. Temporary scarcity gets priced into the front first
Most backwardation spikes begin with a physical or perceived shortage: inventory draws, export disruption, transport bottlenecks, sanctions risk, or conflict premium. Those forces usually hit the nearby months hardest, which is why the front month can become abnormally expensive relative to the back month (Sep – Dec).
2. Normalization does not require a bearish outright tape
The front can fall while the back holds firm, or both months can rise with the deferred month rising faster. Either way, if the spread moves toward normal carry, a short-Sept / long-Dec position can profit.
3. It is a relative-value trade, not just a directional call
By owning one contract and selling the other, you reduce the impact of simple parallel moves in crude and focus on the shape of the forward curve. That is a cleaner way to express a thesis about distorted carry and risk premium.
4. Oil history is full of mean-reverting curve shocks
War premium, embargo stress, OPEC cuts, inventory squeezes, and logistics dislocations can force the curve into steep backwardation. Those episodes often last longer than expected, but once the physical panic stops intensifying, spreads can compress quickly.
Instrument choice
CL is the standard WTI futures contract on 1,000 barrels. MCL is the micro version on 100 barrels. If you want cleaner sizing, better scaling, and more flexibility with risk layers, MCL is usually the better instrument for this type of convergence trade.
Trade structure
Define the spread as Dec 26 minus Sept 26. In backwardation, that number is negative because Sept is above Dec. If you expect normalization, you want that spread to rise toward zero. The practical setup is short Sept 26 and long Dec 26.
S = Price(Dec 26) - Price(Sept 26)S is deeply negative, the curve is steeply backwardated. The trade wins if S becomes less negative.- Sell Sept 2026 and buy Dec 2026 in a 1:1 calendar spread.
- Use MCL when you want to scale in gradually; 10 MCL spreads equal roughly 1 CL spread in barrel exposure.
- Enter in layers when the spread reaches historically extreme backwardation rather than deploying full size immediately.
- Track the spread itself, not just the outright price of crude. Your P&L comes from curve shape.
- Use spread orders when available to reduce legging risk and slippage.
| Scenario | Sept 26 | Dec 26 | Spread (Dec-Sept) |
MCL 1×1 | CL 1×1 |
|---|---|---|---|---|---|
| Entry | 90 | 82 | -8 | – | – |
| Full normalization | 86 | 86 | 0 | +$800 | +$8,000 |
| Partial flattening | 88 | 85 | -3 | +$500 | +$5,000 |
| Both rally, curve still tightens | 95 | 93 | -2 | +$600 | +$6,000 |
| Panic deepens | 96 | 84 | -12 | -$400 | -$4,000 |
| Shock worsens materially | 100 | 85 | -15 | -$700 | -$7,000 |
The biggest mistake in these trades is assuming that “too steep” means “about to reverse.” Oil curves can remain backwardated far longer than expected when the market is pricing a real physical shortage. That means entry timing and sizing matter as much as being directionally right.
What can go wrong
- Geopolitical stress intensifies and the prompt contract gets richer still.
- Inventory draws accelerate, forcing the nearby month to reprice higher than the deferred strip.
- You leg into the spread poorly and lose edge to slippage or execution error.
- You size too large relative to the possibility that the spread widens before it converges.
What disciplined execution looks like
- Scale into the spread in tiers instead of using all your size at once.
- Set spread-based risk limits, not just outright-dollar crude stops.
- Monitor inventories, OPEC posture, shipping disruptions, and geopolitical catalysts.
- Take profits when the curve gets back into a statistically normal zone rather than waiting for a perfect flat line.
That is the enduring reason backwardation provides opportunities: it creates a visible pricing gap between the market’s fear of the present and its estimate of the future. Convergence trades exist to monetize the decay of that fear premium.
This is not financial advice