Where is implied volatility most mispriced ahead of earnings?
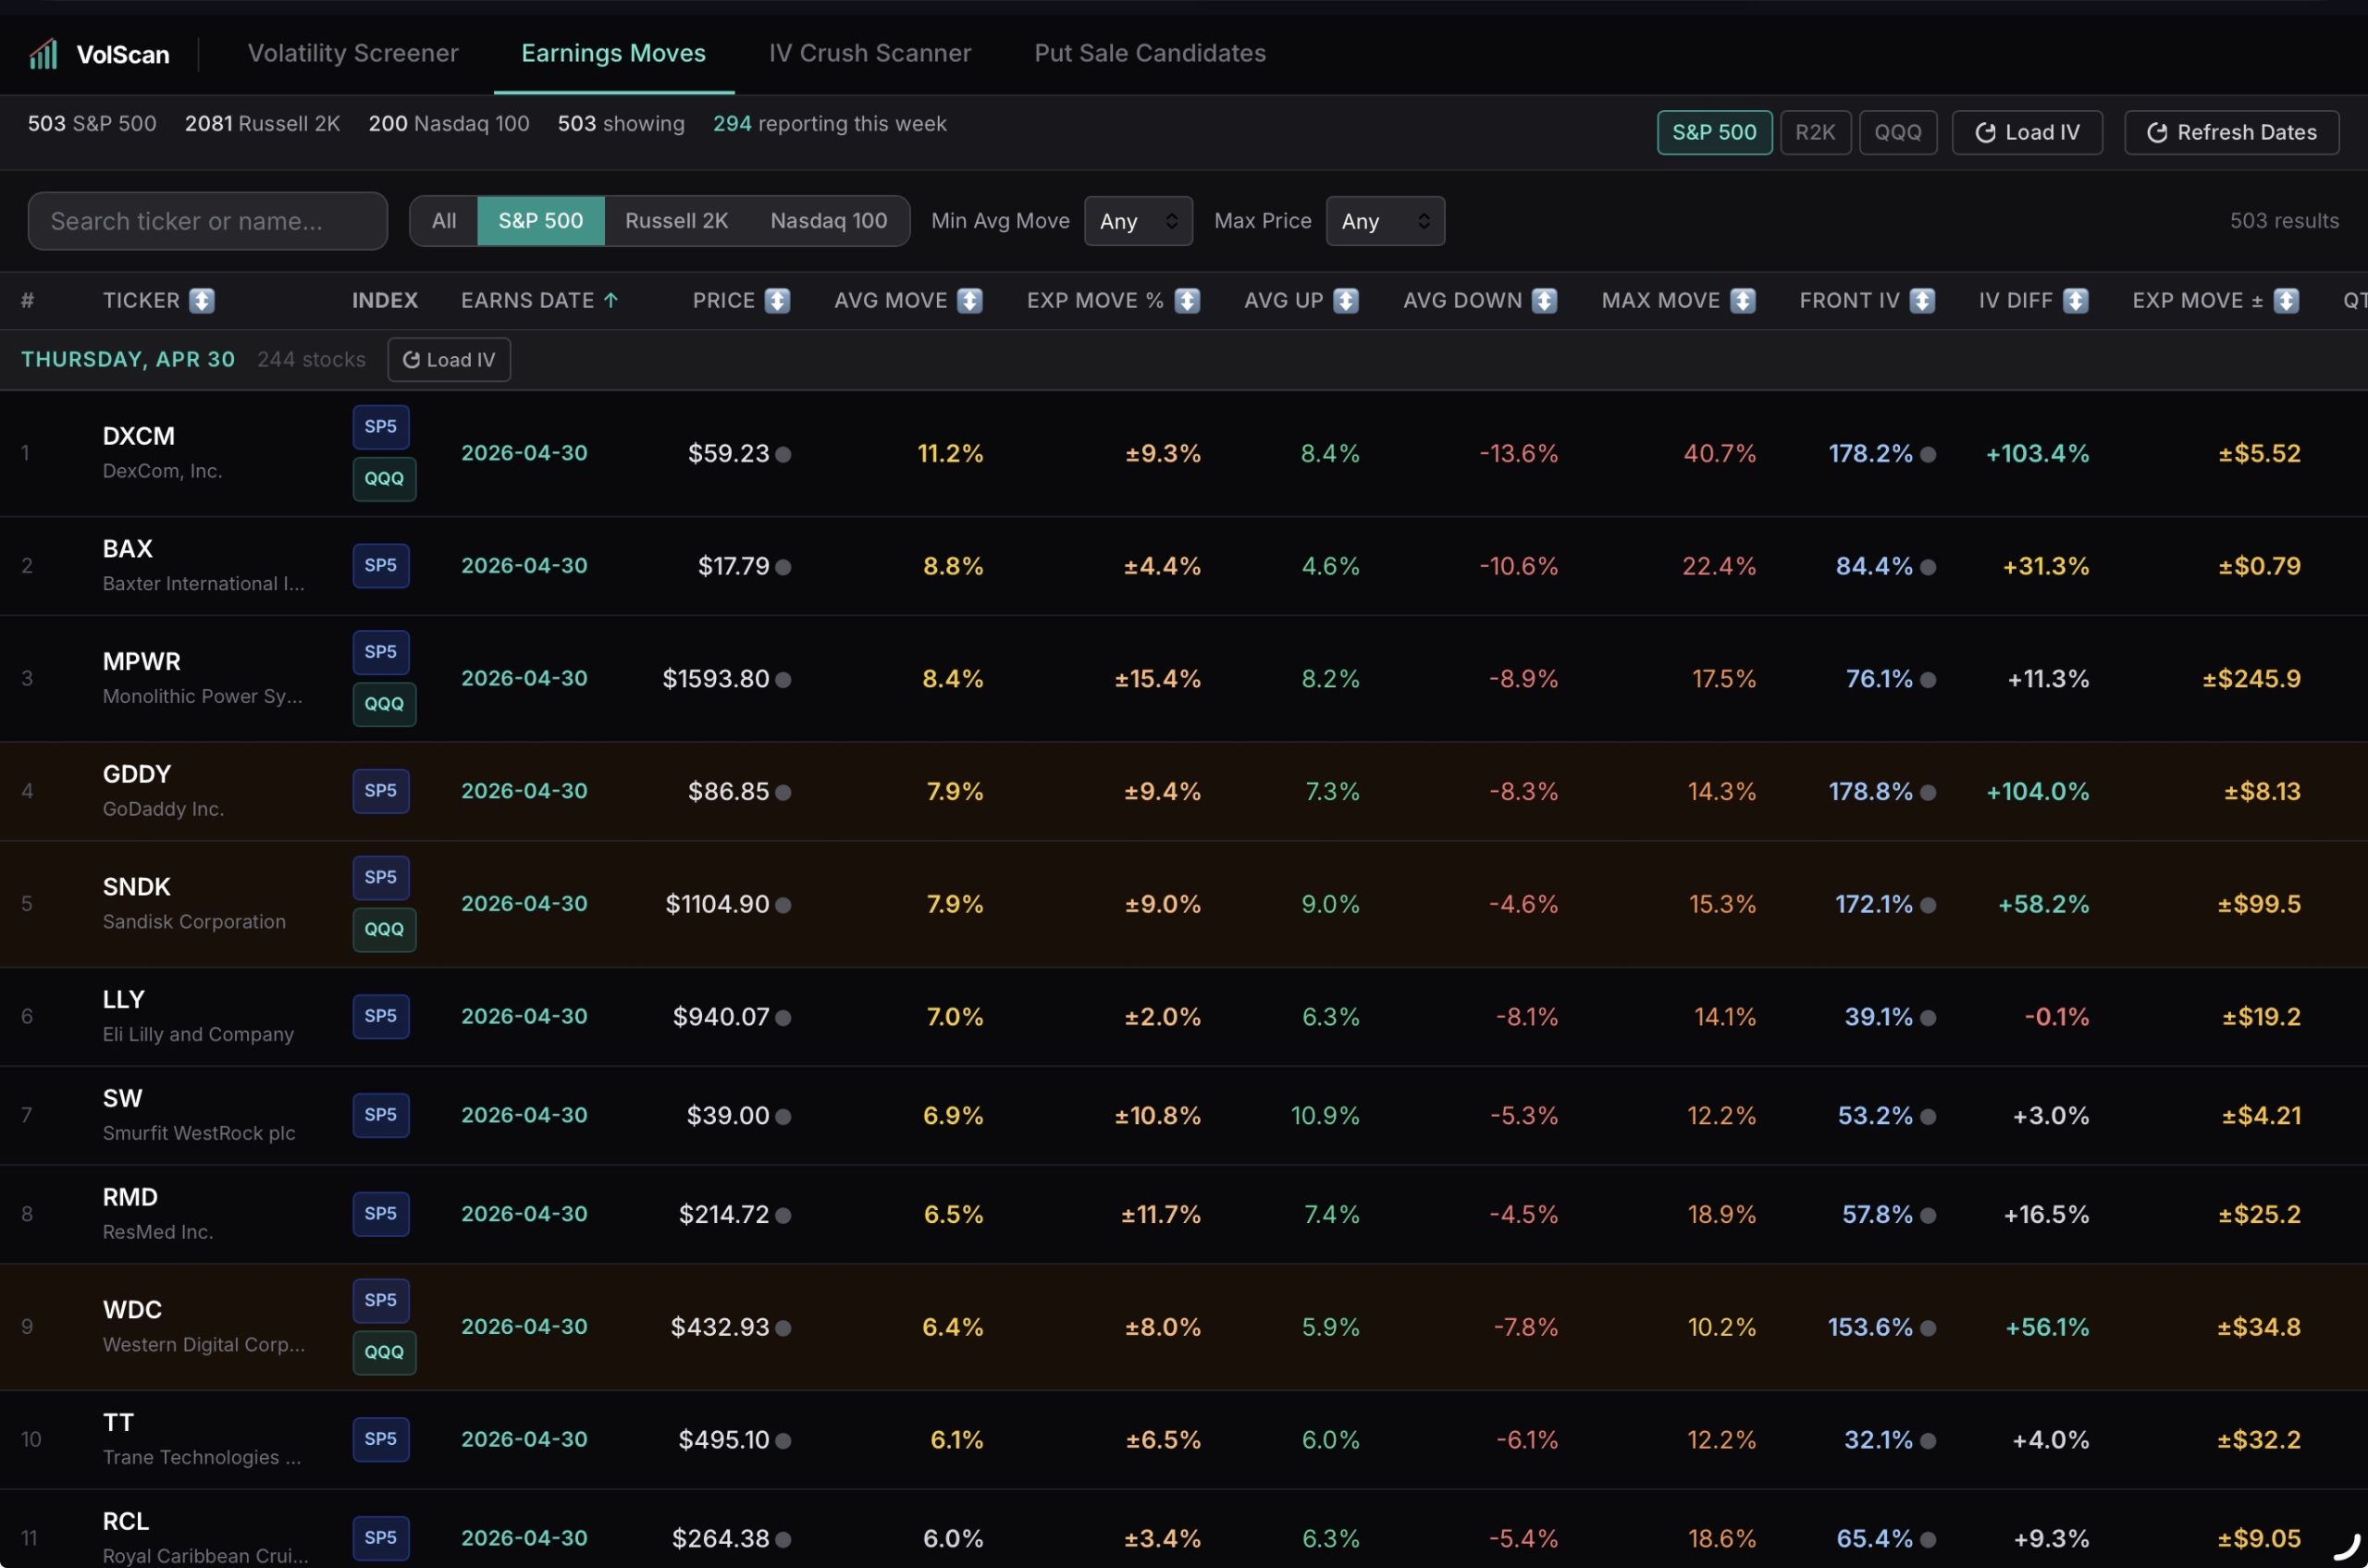
Rather than just flagging high IV, the tool focuses on the relationship between the market’s expected move and the stock’s actual historical behavior around earnings. For each upcoming event, VolScan compares the implied move (derived directly from the options chain) against a distribution of past earnings moves, giving you a clear view of whether options are overpriced or underpriced relative to realized outcomes.
At its core, the model is looking for asymmetry. When implied volatility significantly overstates what the stock has historically delivered, that creates a potential volatility crush opportunity—where premium sellers can benefit not just from directionless price action, but from the systematic collapse in IV post-event. Conversely, when implied moves are too low relative to realized history, the tool highlights potential long-volatility setups.
The Earnings Move tab ranks opportunities based on multiple factors, including implied vs. realized move spread, consistency of past earnings reactions, and current term structure dynamics. This allows you to quickly filter out noise and zero in on the cleanest setups—names where the edge is not just theoretical, but repeatable.
For volatility sellers, the ideal candidate is one where:
-
Implied move is meaningfully above historical averages
-
Past earnings moves show tight dispersion (predictable behavior)
-
Front-month IV is elevated relative to back months (clear crush setup)
For traders running short straddles, iron condors, or delta-neutral premium strategies, this provides a systematic way to identify where the market is overpaying for uncertainty. Instead of scanning manually or relying on gut feel, VolScan quantifies the edge and surfaces it in real time.
In short, the Earnings Move tab transforms earnings from a guessing game into a data-driven volatility trade—helping you consistently target the setups where IV is most likely to collapse and premium is most mispriced.