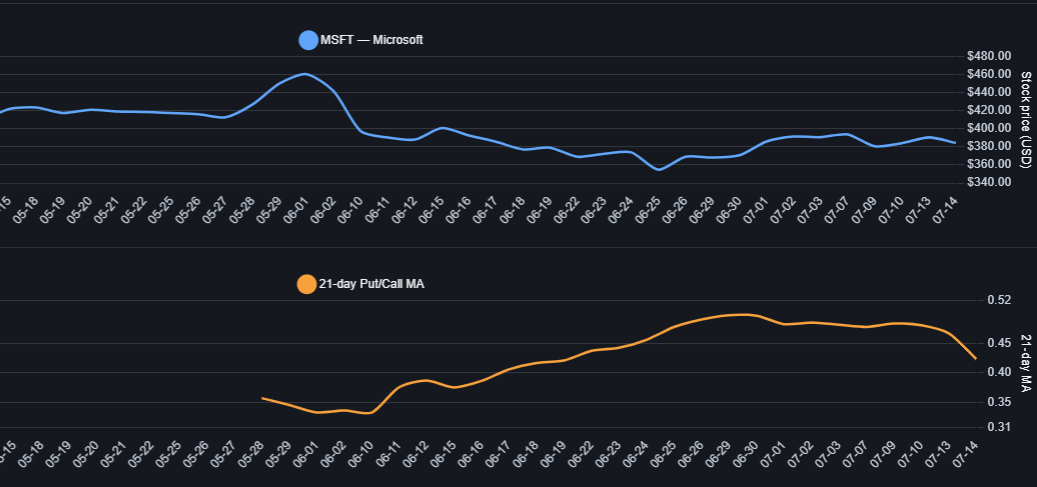
The 21‑day put/call ratio for MSFT is trending lower and sits well below its own 52‑week average, indicating a shift toward call dominance and increasingly bullish options sentiment rather than demand for downside
Current 21‑day put/call context
- Recent MSFT open‑interest put/call ratio is about 0.4, below a 52‑week average near 0.6, meaning calls materially outnumber puts on OI
- Other MSFT options sources show similarly low put/call readings (volume and OI ratios well under 1), which is typically interpreted as bullish or call‑heavy positioning.
The 21‑day moving average of the put/call ratio rises into late June, then rolls over and declines into mid‑July, consistent with a transition from relatively heavier put interest toward stronger call interest.
What a declining 21‑day put/call ratio means
- A falling ratio mechanically means either call volume/OI is growing faster than puts, or put activity is cooling while call activity remains strong.
- When the ratio is below 1 and declining, the options market is tilting toward upside exposure (speculative calls, covered calls, or call‑side hedges) rather than downside protection via puts.
- For MSFT specifically, total options OI is high relative to its 52‑week history, and the put/call OI ratio below average shows that this extra positioning is skewed toward calls.
In other words, the 21‑day decline you’re seeing is not just “less fear” but an active shift in positioning toward bullish structures.
Bullish and contrarian interpretations
- Directional/bullish read:
A declining and sub‑1 put/call ratio often aligns with bullish price trends, as traders add calls to participate in upside or express. - Contrarian read:
From a sentiment‑contrarian lens, an extended period of very low put/call ratios can signal crowded optimism; historically, technicians sometimes treat extremely low 21‑day equity put/call readings as a condition where upside is more fragile, not as a precise sell signal.
So for MSFT, the present level and direction of the 21‑day ratio argue that the options market is broadly optimistic.