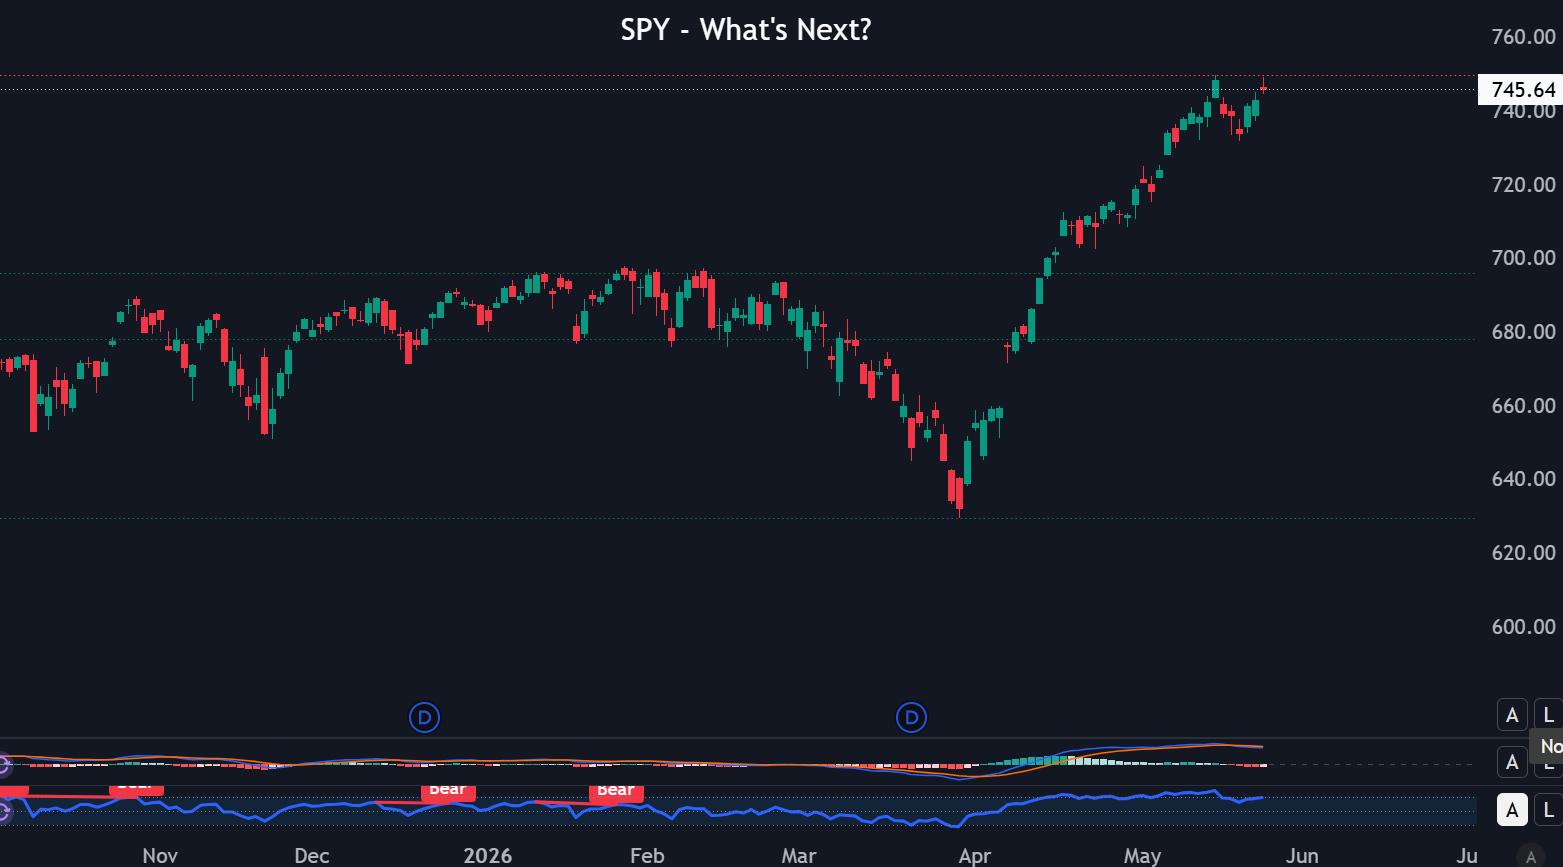
SPY is still in an uptrend, but the tape looks extended and vulnerable to short-term consolidation.
The daily structure remains bullish because price has recovered sharply from the spring low and is still holding a clean sequence of higher highs and higher lows. The bigger issue here is not trend failure, but momentum fatigue as SPY presses into the recent highs near 748 to 750.
Trend Structure
The chart shows a powerful V-shaped recovery followed by a steady staircase higher, which is normally a bullish continuation pattern until proven otherwise. Price is also well above the prior breakout region, which means the broader trend still favors buyers on pullbacks rather than aggressive shorting into strength.
In plain terms, this is not a chart that looks broken. It looks like a strong trend that has already run hard and now needs to either digest gains sideways or retrace modestly before attempting another leg up.
Momentum Read
MACD remains positive, but the histogram is fading and the lines are starting to flatten while price is testing recent highs. That setup usually points to slowing upside momentum, which often leads to chop, stalled breakouts, or a shallow pullback instead of an immediate vertical continuation.
RSI also appears to be cooling from elevated levels, which reinforces the idea that the market is strong but a bit tired. When momentum cools while price stays near the highs, the next move is often rotation and consolidation rather than trend reversal.
Most Likely Path
Base Case
SPY chops or drifts slightly lower over the next several sessions, holds above first support, and then attempts another breakout later. This would be the healthiest outcome and would keep the larger uptrend intact.
Bullish Extension
A clean daily close above 750 with follow-through would signal that buyers are still in control and could open the door to a push toward the next measured upside zone in the 770 to 780 area.
Bearish Shift
A failure back below the first support shelf would be the first warning that momentum is rolling over. A deeper break into the prior breakout area would shift the chart from healthy digestion to a more meaningful corrective phase.
Directional Take
Two ways to express strong uptrend with short term consolidation risk in SPX and SPY options.
SPY is pressing into new highs around 745 to 746 with SPX near 7,470 to 7,500 while daily momentum starts to cool. That backdrop favors plays that respect the uptrend but also assume some consolidation or a shallow pullback rather than an immediate melt up.
Play 1 | 1 Week SPX Iron Condor
The first expression is a short term SPX iron condor built around the idea that after a strong run into resistance the index is more likely to chop or mean revert than to trend aggressively beyond the weekly expected move.
With SPX near 7,470 to 7,500, you can sell premium just outside the one week expected range and buy wings further out to define risk. You get paid if SPX simply stays within a broad band while time decay works in your favor.
Example structure: sell the 7,350 put and 7,550 call, then buy the 7,250 put and 7,650 call for protection. For illustration, this chart assumes a 25.00 point credit on a 100 point wide condor, which gives a max profit of 25.00, a max loss of 75.00, and break even levels at 7,325 and 7,575.

The green line now sits above the zero line because the chart is plotted with actual payoff values rather than a stylized shape. The plateau is the max profit region, while losses accelerate outside the break even points and flatten at the defined max loss.
Iron Condor Playbook
This setup fits best when the trend is strong but extended in the short term, momentum is cooling, and there is no obvious near term catalyst that could cause a large repricing.
Risk management matters. Many traders cap the loss at roughly 1 to 1.5 times the original credit or close early if price trades through a long wing and skew starts moving against the position.